My Standard Celeration Chart demonstrates that my performance on my second pack of cards continued to improve during the course of the week. Between Monday 9th December and Friday 13th December, the number of learning opportunities I made each day was fluctuating around an average of roughly 10 per day. Despite the fluctuation in the number of errors, the number of correct responses made each day increased at a steady rate, along my minimum celeration line. Consequently, I managed to double the number of correct responses made in one week, from 8 correct responses on Monday 9th December, to 18 correct responses on Sunday 15th December. Due to these improvements in my performance, the data plotted on my Standard Celeration Chart now represents a ‘Crossover Jaws’ learning picture, as the number of correct responses has become greater than the number of learning opportunities.
As my performance was only improving by a couple of cards each day, I decided to implement an error correction intervention, where I went through the entire pack of cards, providing a correct answer to each one, before conducting my daily timing session. My Standard Celeration Chart demonstrates that this intervention was successful, as my performance jumped-up and turned-up. Consequently, the number of correct responses made each day is above my original minimum celeration line, meaning that I may have to draw a second minimum celeration if my performance remains above the line. If my performance continues to improve at the same rate, I should be able to reach my fluency aim (60-80 cards) in approximately the same amount of time that it took me to become fluent on pack one.


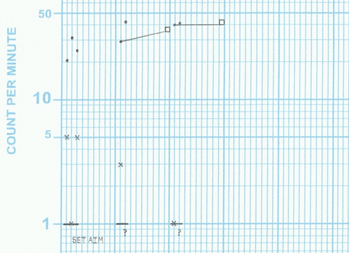
The Timings Chart above displays the data I collected when I started using my second pack of French vocabulary SAFMEDS cards, on Monday 9th December.


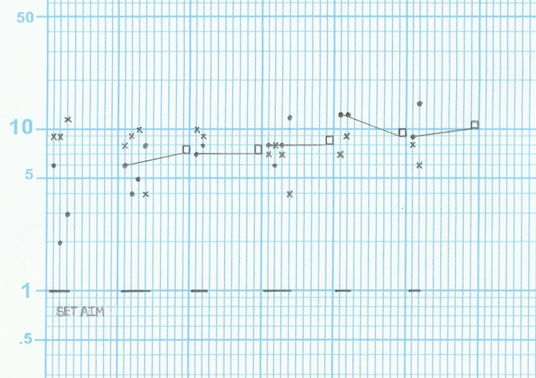
The second Timings Chart displays the data I collected towards the end of the week, when I implemented my intervention, between Saturday 14th December and Tuesday 17th December.